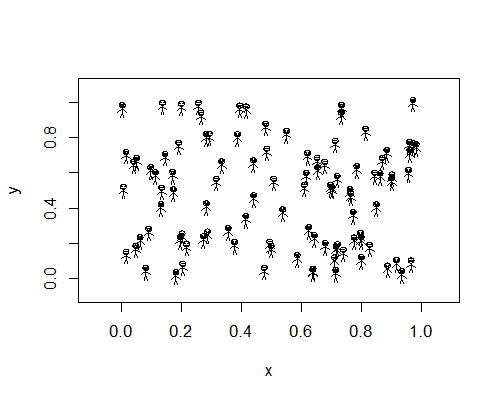
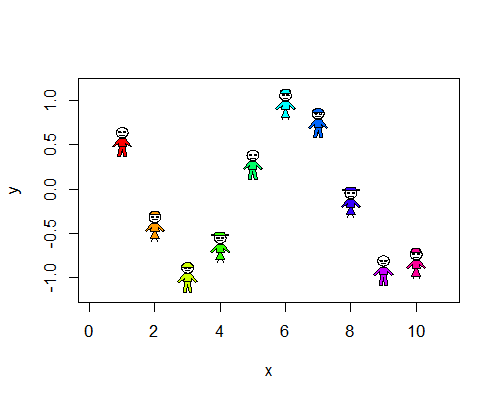
An R package to create stickmen and stick women on a plot.
Installation from github requires the devtools package to be installed.
# install devtools for devtools::install_github
install.packages("devtools")
require(devtools)
# install stick package
install_github("EconometricsBySimulation/R-Graphics/Stick-Figures/stick")
This package also includes tests in testthat format. From R run the call test_package("stick").
This R package contains functions for adding stickpeople to a plot.
require(stick)
set.seed(68331)
plotStick(x = runif(100), y = runif(100))plotStick(x = 1:10, y = cos(1:10),
hat = c("none", "shapka", "beanie", "fedora"),
col = rainbow(10), cex = 2)
