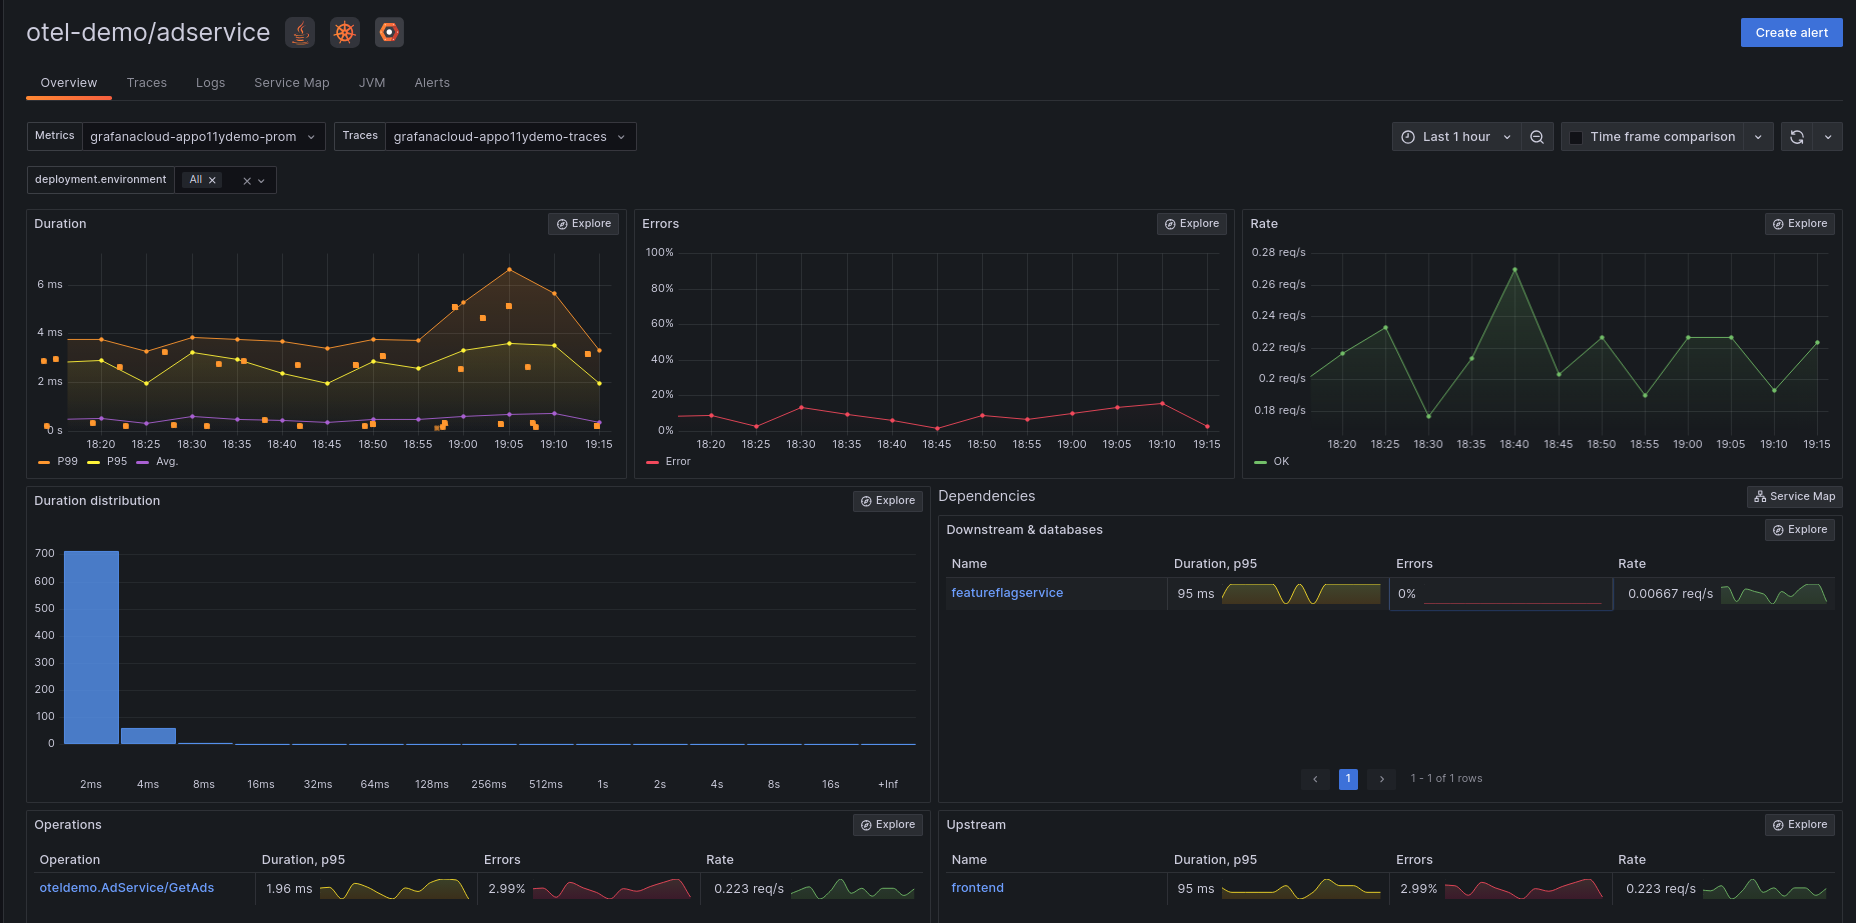
Grafana Distribution of OpenTelemetry Instrumentation for Java - optimized for Grafana Cloud Application Observability.
This project provides a Java agent JAR that can be attached to any Java 8+ application and dynamically injects bytecode to capture telemetry from a number of popular libraries and frameworks.
Why use this distribution instead of OpenTelemetry Instrumentation for Java (upstream) directly?
- Easy to get started: This distribution is optimized for Grafana Cloud Application Observability - you can get started with just a few environment variables.
- Fully Compatible: This distribution is fully compatible with upstream - you can use all configuration options of upstream.
- Optimized for Application Observability and Alloy: No need to tweak any configuration settings if you use the latest version of Alloy.
- Fast Bug Fixes: We can fix bugs faster without waiting for the next release of upstream.
- Cost Optimized: You can save costs by sending only the metrics that are actually used by the dashboards in Grafana Cloud Application Observability (opt-in).
Open Source Friendly:
- You can use OpenTelemetry Instrumentation for Java directly for Grafana Cloud Application Observability - this distribution is just a convenience wrapper. You can find more information how to send telemetry data to Grafana Cloud Databases here.
- You can use this distribution for any OpenTelemetry use case, not just Grafana Cloud.
- You can migrate from this distribution to OpenTelemetry Instrumentation for Java as explained below.
The documentation can be found in Grafana Cloud / Application Observability / Instrument / Java.
- Java 8+
- Spring Boot 2.7+
- Older Spring Boot versions also mostly work, but this is not tested explicitly
- We regularly update to the latest version of OpenTelemetry Instrumentation for Java - you can find the current version here
Follow these steps if you want to migrate from this distribution to the upstream project OpenTelemetry Instrumentation for Java:
- If you use Data Saver, you can filter the metrics in the OpenTelemetry Collector instead (docs).
- Add the environment variables below for the best experience with Application Observability:
export OTEL_INSTRUMENTATION_MICROMETER_BASE_TIME_UNIT=s
export OTEL_INSTRUMENTATION_LOG4J_APPENDER_EXPERIMENTAL_LOG_ATTRIBUTES=true
export OTEL_INSTRUMENTATION_LOGBACK_APPENDER_EXPERIMENTAL_LOG_ATTRIBUTES=true To engage with the Grafana Cloud Application Observability community:
- Chat with us on our community Slack channel. To invite yourself to the Grafana Slack, visit https://slack.grafana.com/ and join the #application-observability channel.
- Ask questions on the Discussions page.
- File an issue for bugs, enhancements, and feature suggestions.


