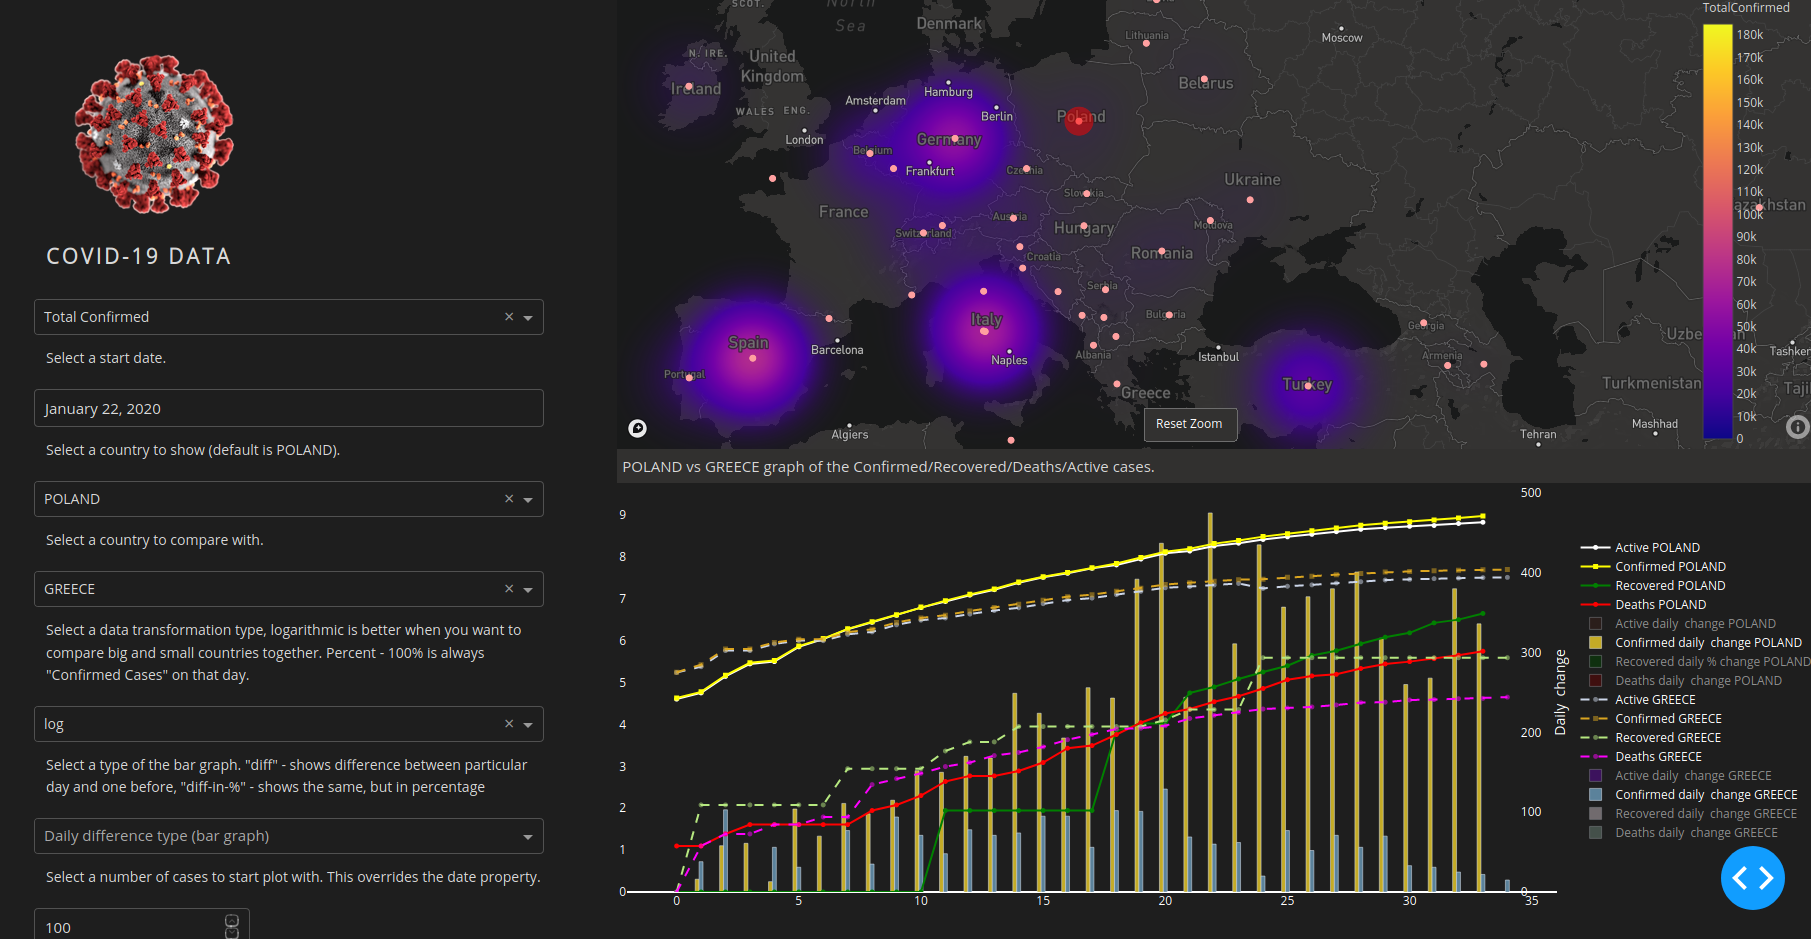
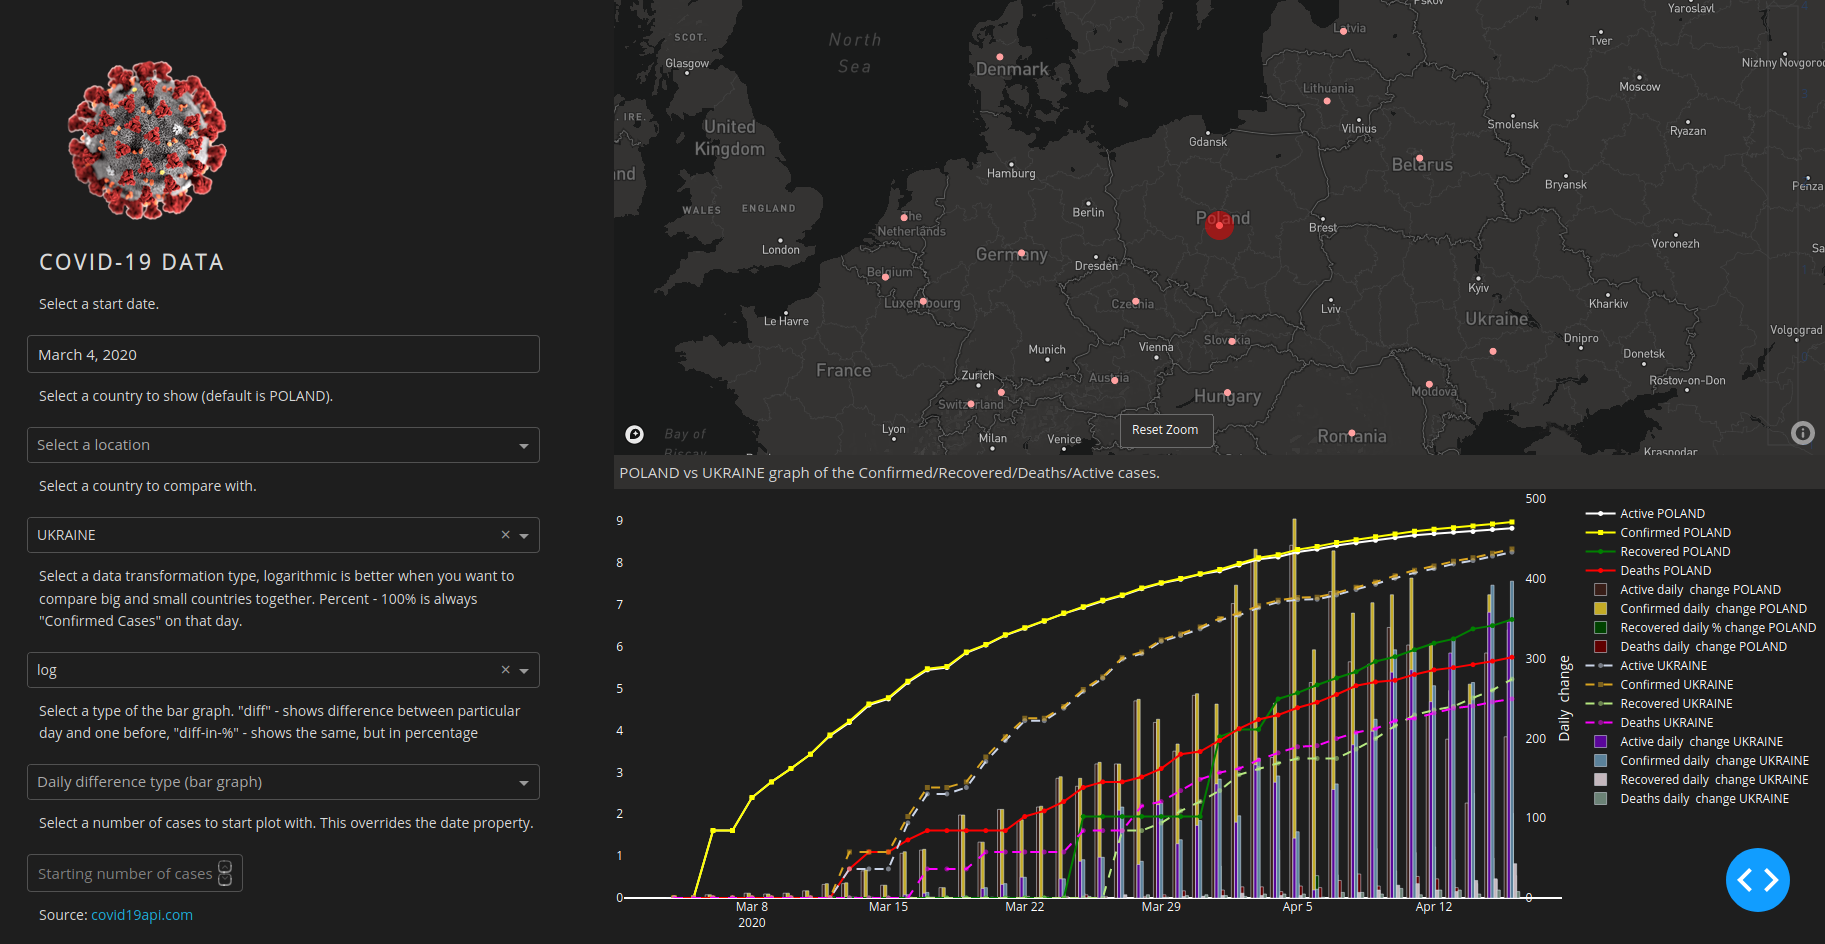
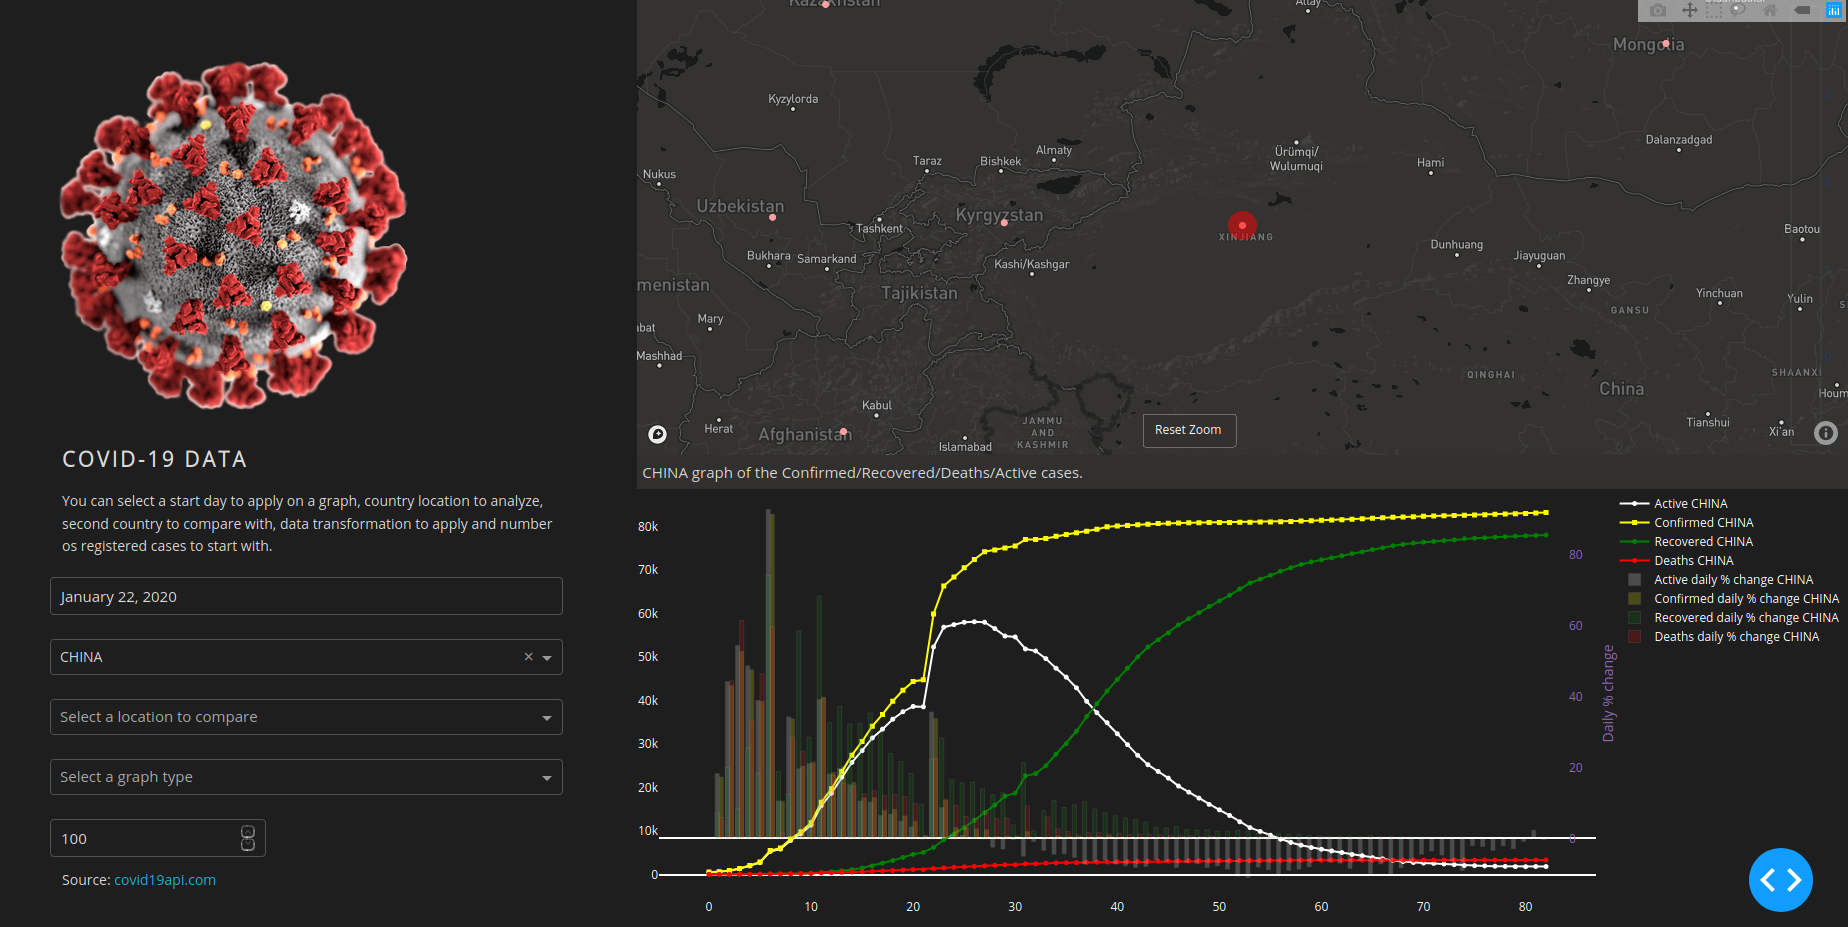
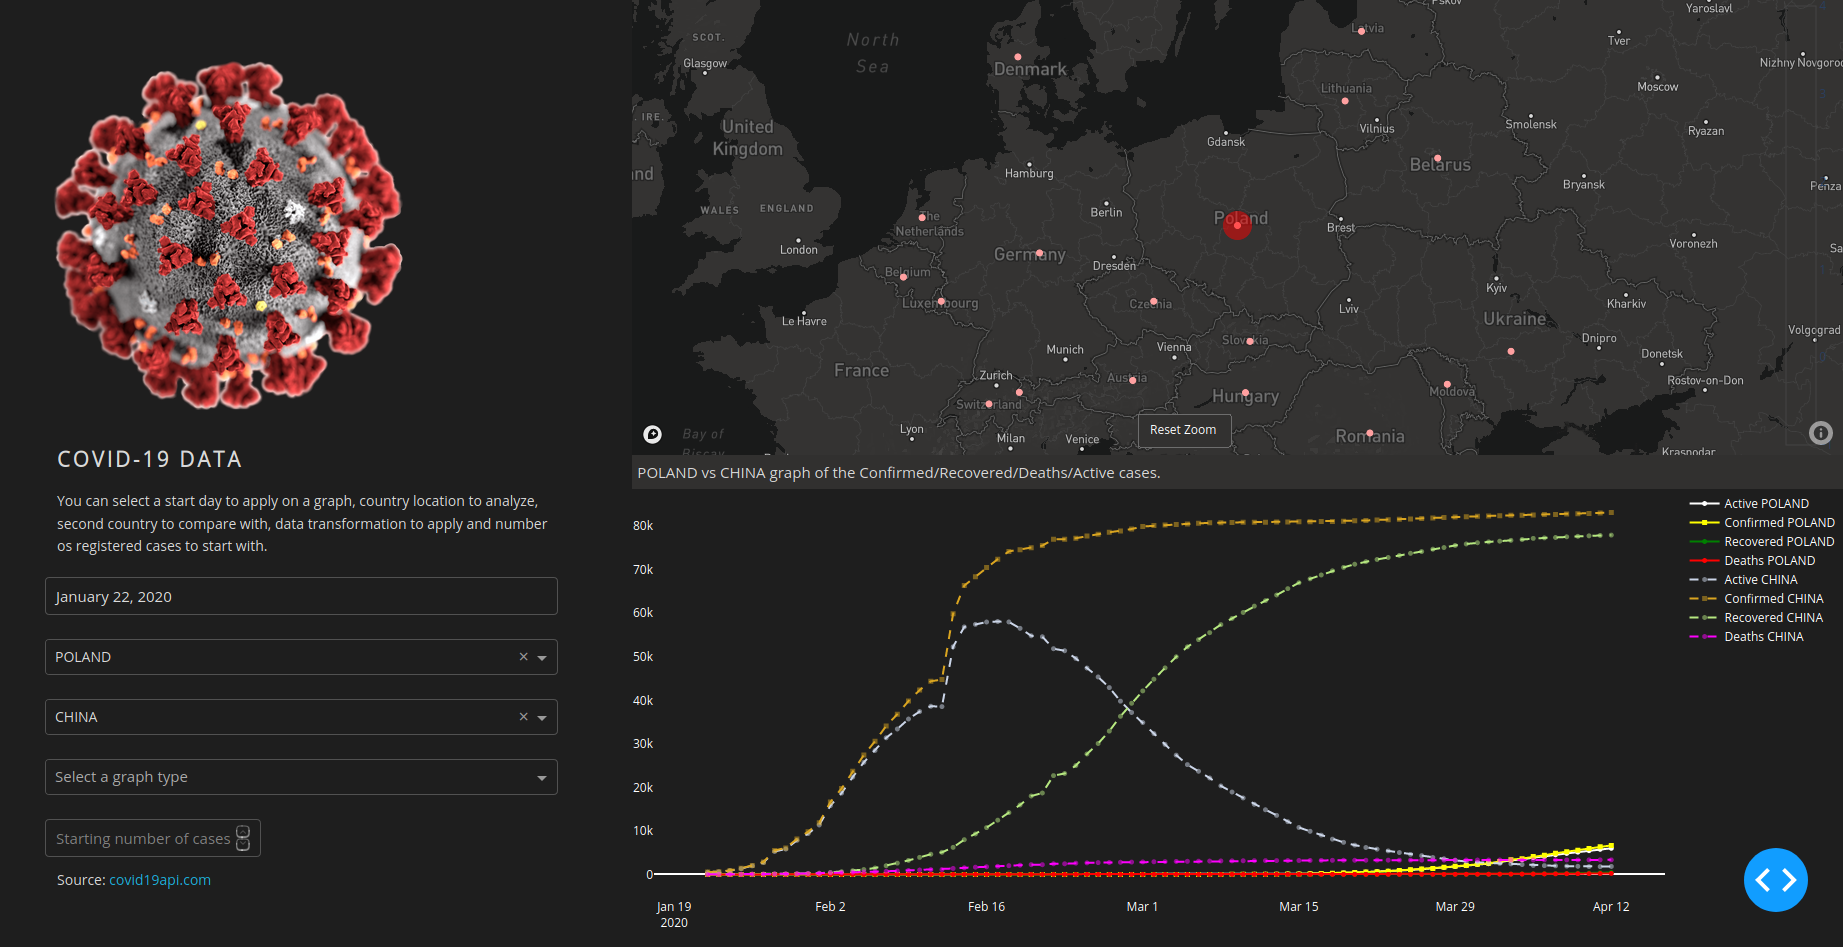
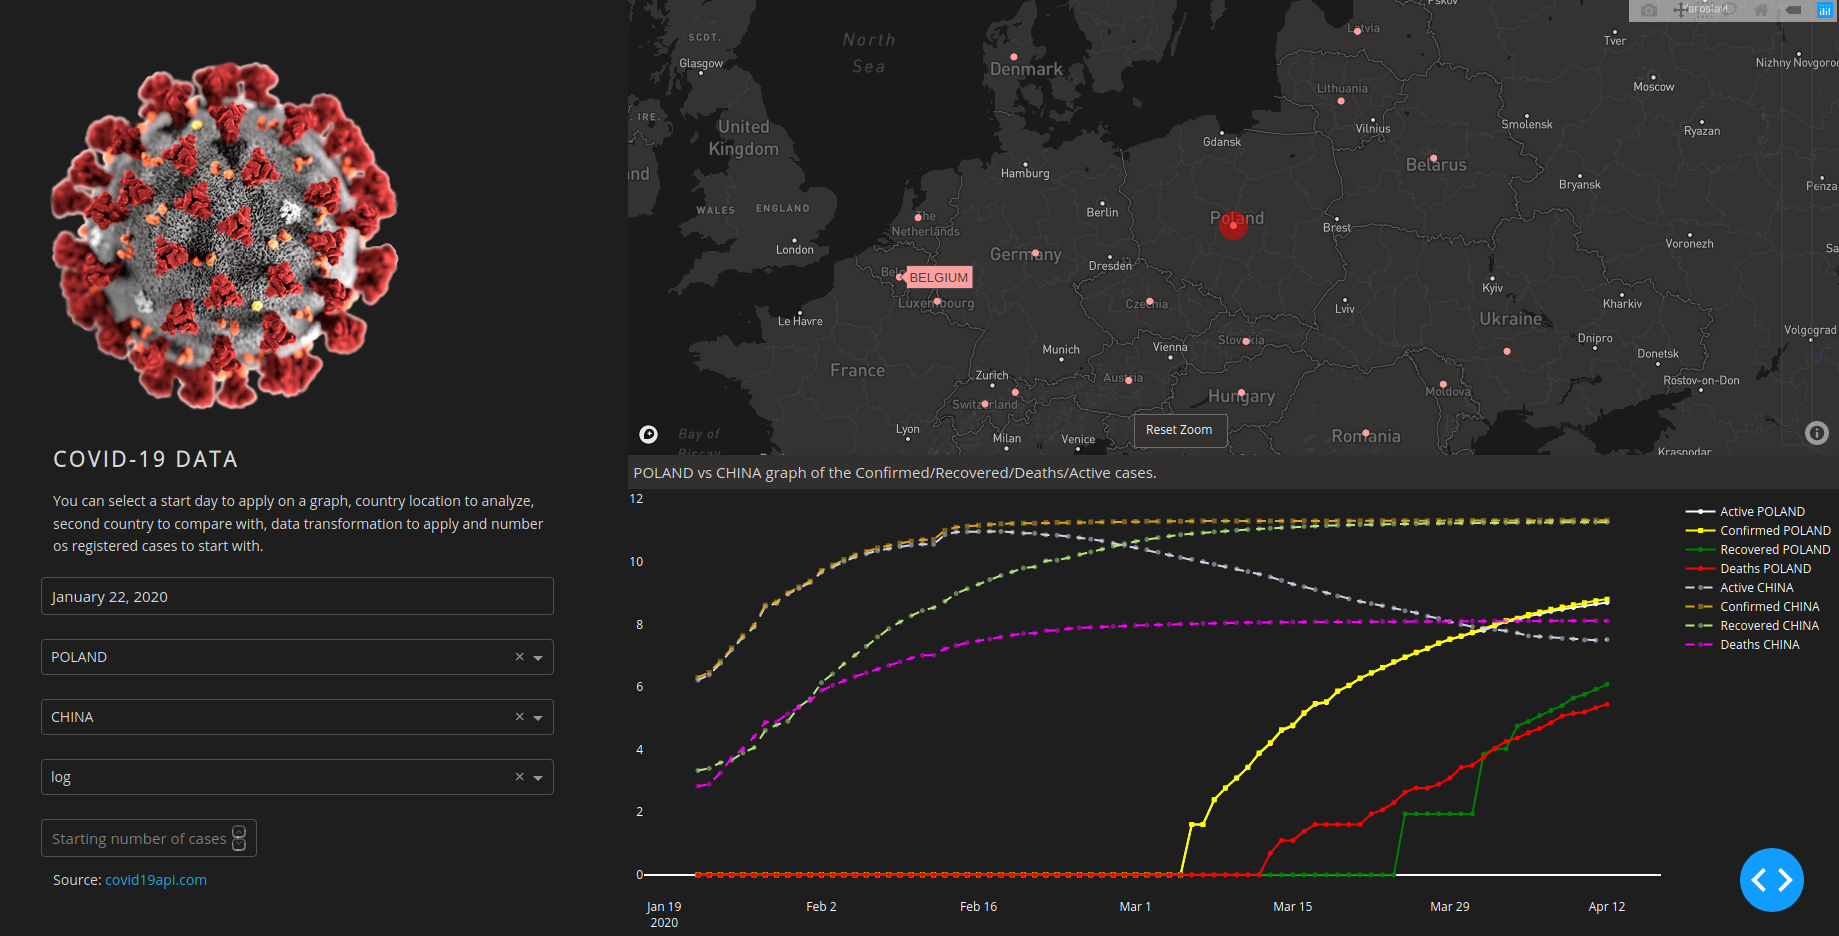
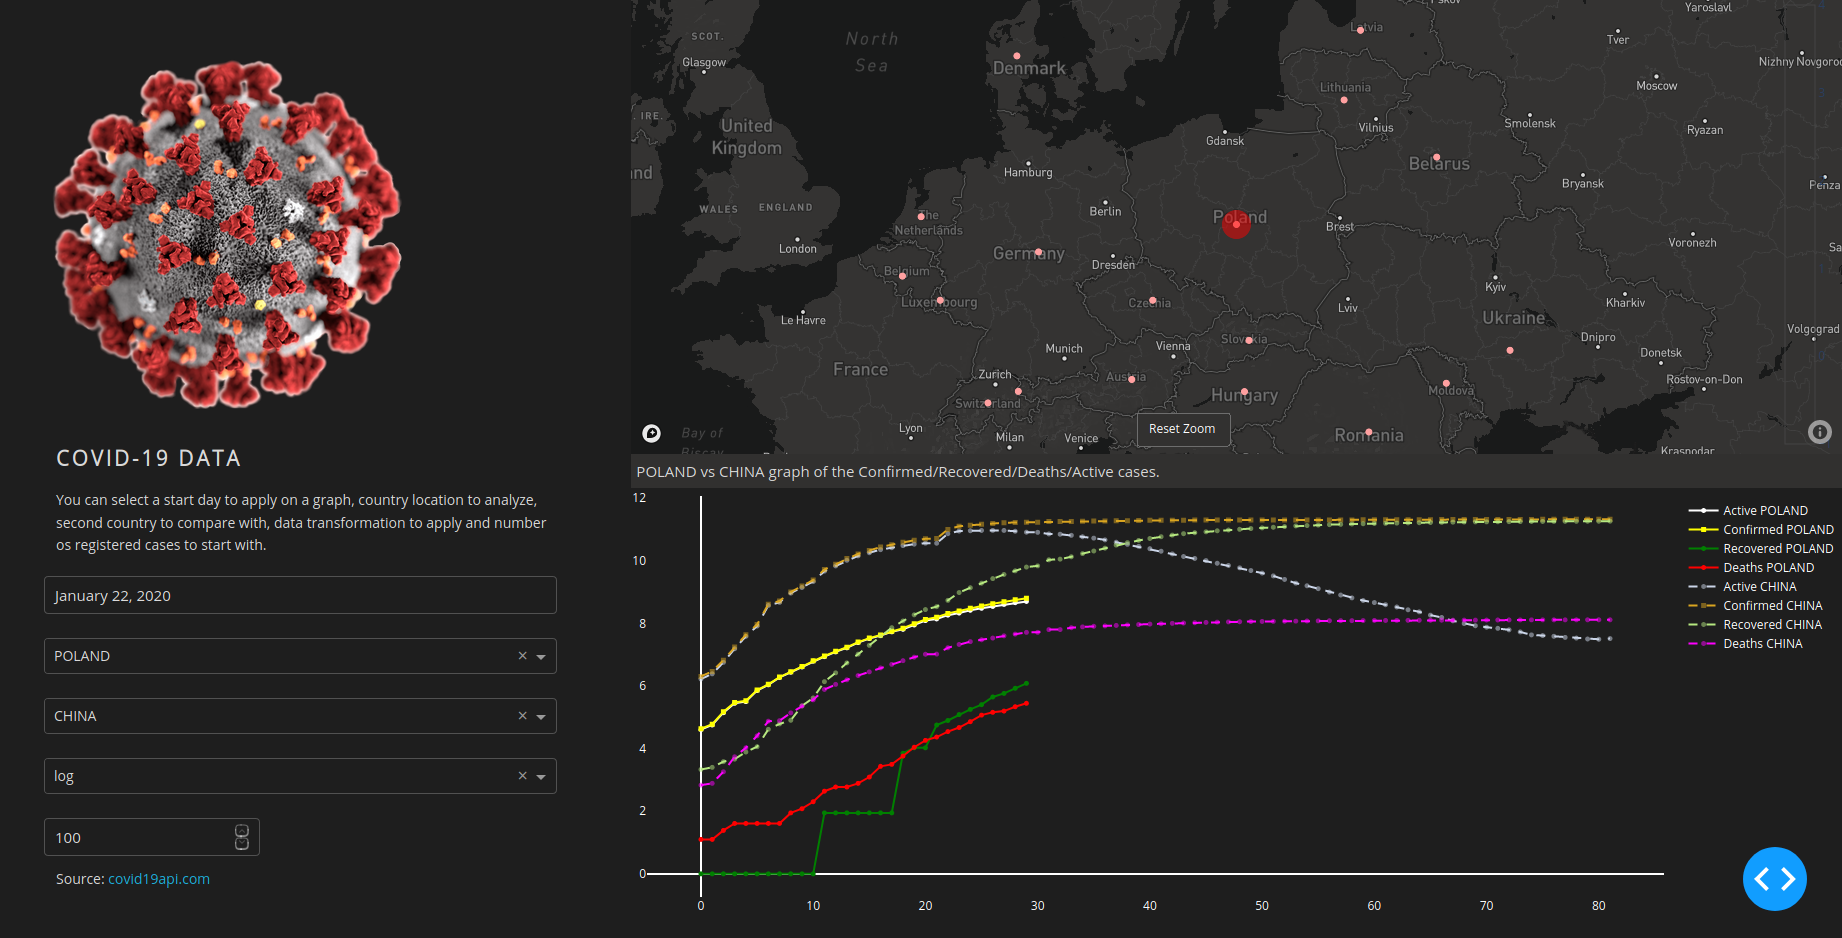
covid_dashboard is a python application based on a dash framework.
It presents a user interface to analyze data gathered from:
covid19api.com
Dashboard is available via docker: amasend/covid_dashboard:1.7
You need to install a docker on your system, please refer to docker installation process:
https://docs.docker.com/get-docker/
After docker installation just run:
docker run -ti -p 8050:8050/tcp amasend/covid_dashboard:1.7
and go to 127.0.0.1:8050 in your browser.
1.7 - API fix (incorrect last date that crashed data preprocessing)
1.6 - fix for data per 1mln population when population is lower than 1mln
1.5 - added visualization per 1mln population in each country, better API error handling (some countries have corrupted data,
eg. USA sometimes will not load because an API does not return data.)
1.4 - added UI revision to be persisted, corrected some locations on map, change in log scale and yaxis info, updated hover info for heat-map
1.3 - added heat-map with world data
1.2 - changed main screen with descriptions, added option to select bar graph type (normal diff or with %)
1.1 - added support for bar plots (only main selected country),
bar plots show a daily % change for each category of data
1.0 - initial base container
