The differential equation based model as described above assumes that there are many agents who are randomly interacting. We now discuss an agent-based model where we distinguish susceptible, infected and recovered agents.
Given are agents connected in a network. The network is generated as follows. First all the agents are randomly put on the landscape.
crt number-of-nodes
[
  setxy random-xcor random-ycor
]
Then we define the number of links that will be generated such that the network has a specific average degree average-node-degree.
let num-links (average-node-degree * number-of-nodes) / 2
Links are added one by one until the number of links is reached. Every time step one of the turtles is selected randomly and the nearest turtle to it is selected and a link is made between them.
while [ count links < num-links ]
[
  ask one-of turtles
  [
    let choice (min-one-of (other turtles with [not link-neighbor? myself])[distance myself])
    if choice != nobody [ create-link-with choice ]
  ]
]
Agents who are connected may affect each other’s state. Infected agents may infect susceptible agents. Each susceptible neighbor of an infected agent has the probability virus-spread-chance to get infected. Each infected agent has a probability recovery-chance of recovering. If an agent recovers, it can become immune with probability gain-resistance-chance or become susceptible again. This is implemented in Netlogo in the following way.
ask turtles with [infected?]
[
  ask link-neighbors with [not resistant?]
  [
    if random-float 100 < virus-spread-chance
    [
      set infected? true
      set resistant? false
      set color red
    ]
  ]
]

ask turtles with [infected?]
[
  if random 100 < recovery-chance
  [
    ifelse random 100 < gain-resistance-chance
    [
      set infected? false
      set resistant? true
      set color gray
    ][
      set infected? false
      set resistant? false
      set color green
    ]
  ]
]
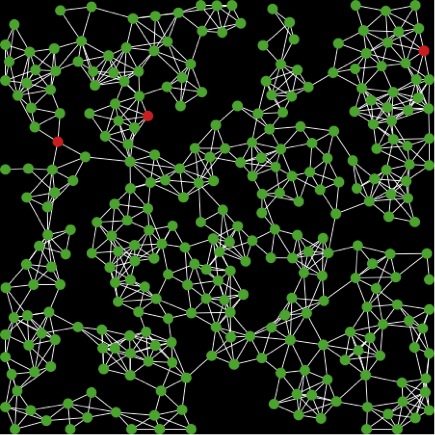
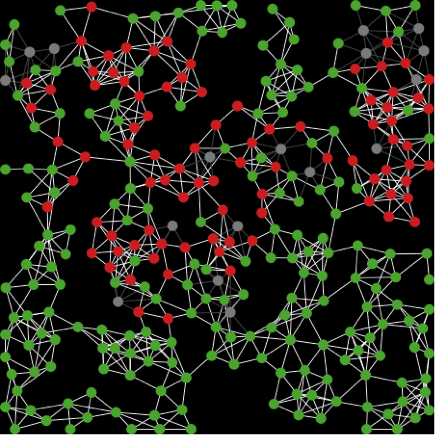
We see that the virus spreads through the network (Figure 2). Initially three agents are infected and within a few time steps we see the red color start spreading.
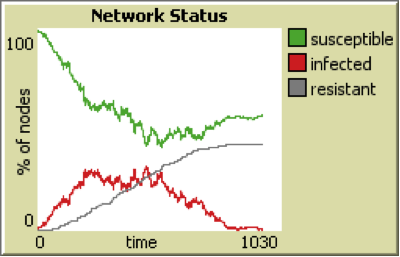
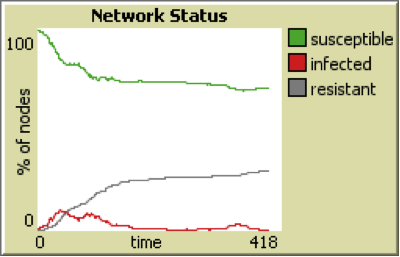
If the probability of becoming resistant is high, the disease stops spreading early compared to lower level of recovery-chance. Figure 3 shows that with a low value of recovery-chance the virus spreads to about 40% of the population since agents get sick again after recovery (becoming susceptible), while it is contained to below 10% with recovery-chance equal to 50%.
*
Figure 2: A network of agents where green agents are susceptible, red agents are infected and grey agents are recovered agents. Left is the initial state of the network. Right is the network after 214 time steps. The probabilities used are virus-spread-chance = 0.025, recovery-chance = 0.05 and gain-resistance-chance = 0.05.*
*
Figure 3: Spread of the virus in the population with recovery-chance = 0.05 (top) and recovery-chance = 0.5 (bottom).*
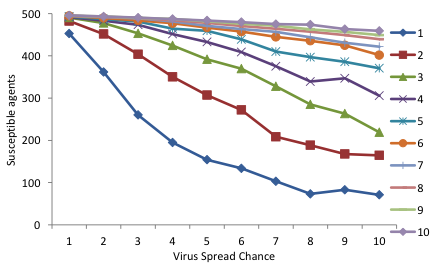
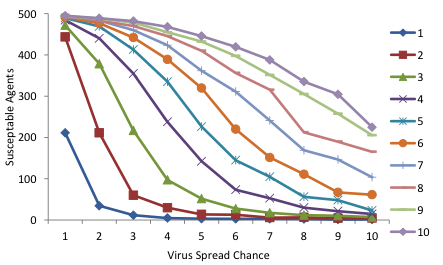
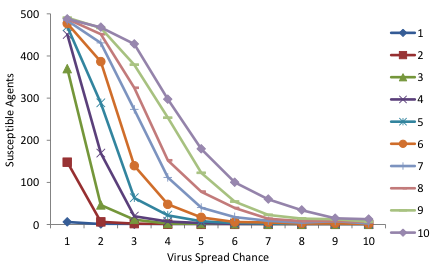
We will now explore the consequences of the parameters virus-spread-chance and recovery-chance and assume that agents who recover do not become susceptible again (gain-resistance-chance = 1). We will see the consequences for average degrees 4, 6 and 9 for a population of 500 agents. Each parameter combination is run 100 times. Figure 4 shows that a higher degree leads to more agents getting the virus. Furthermore, we see that a higher probability of spreading the virus leads to more agents getting sick, and a lower recovery rate also leads to more agents getting sick.
*
Figure 4: The average number of susceptible agents out of a population of 500 after 100 runs of 1000 time steps for different parameter settings. The upper figure is for an average degree of 4, the middle for an average degree of 6 and the lower figure for an average degree of 9. The horizontal axis shows the probability the virus is spread (from 1% to 10%) and the individual lines are the recovery chance (from 1% to 10%).*
NETLOGO EXAMPLE: CONTAGION ON A NETWORK IN
Model: Right click on the Link and Save it. Open Netlogo and Run it with NetLogo.